
© MMXX V.1.0.2
by Morley Evans


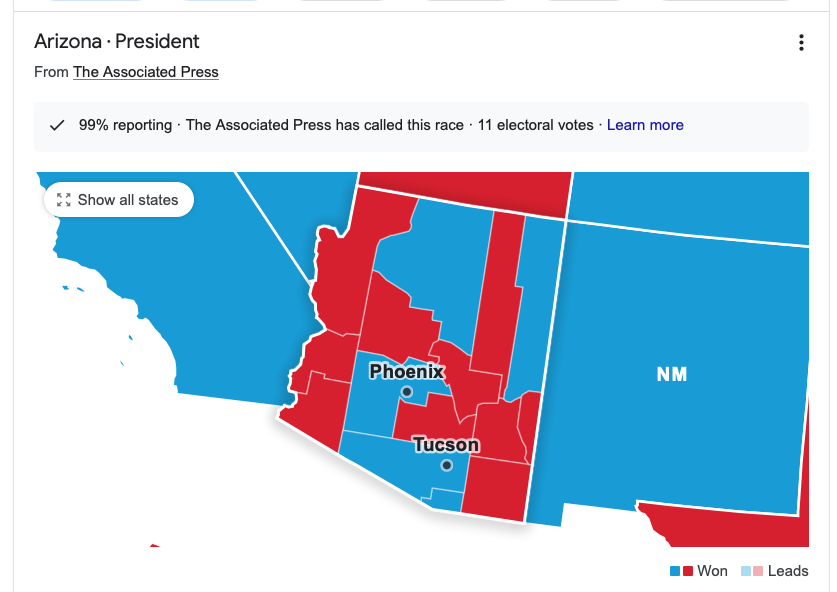


These are the US Presidential election 2020 results by Googling "US election 2020 map". These were published by Associated Press (AP). If one clicks on a State, the details of the vote are revealed, county-by-county. Curiously, Red (Trump) dominates the Blue States everywhere but major urban centres. That is not a coincidence.
This is true in New York State, which is solid Red, except for NYC, Albany, Rochester, Syracuse, and Buffalo. Long Island is RED.
Every state follows this pattern, except, notably, California, where Red and Blue are weaker, but the pattern persists.
This curiosity could be due to farmers, cowboys, and hillbillies, voting for Trump and sophisticated, educated, urbanites, voting for Biden. It could be the result of something else.
Rudy Giuliani says the Democrat election corruption machines explain the Democratic Party strength in the urban areas. We'll have to wait for the investigation and the lawsuits to find out more.
Democratic Party election control machines are a proven reality in cities like Detroit, Chicago, Washington, New York, Los Angeles, Philadephia, and Pittsburg where they have been running and fixing elections for decades.
Apparently, Republicans are popular, not only in "fly-over-States" but also in "fly-over-counties."
Take out a few votes in the cities, and it looks like a landslide for Trump.

Most Americans are not only deplorable. Most Americans are also revolting.


California Presidential Election 2020 country-by-county
.

No comments:
Post a Comment